LOADING
The Prawns x Altered State Machine
Community Genome Mapping Event Results
Thank you to all who took part!
We had over 24% of all wallet owners, who represent over 37% of Genesis Brain Hodlers take part in the event and we received some great mapping suggestions from the community...
...along with some more... interesting suggestions.
...along with some more... interesting suggestions.
Plunger mapping courtesy of Chasing Tales
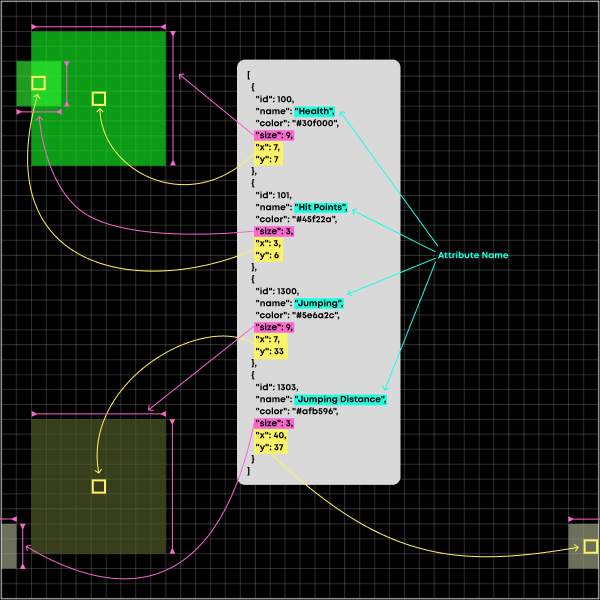
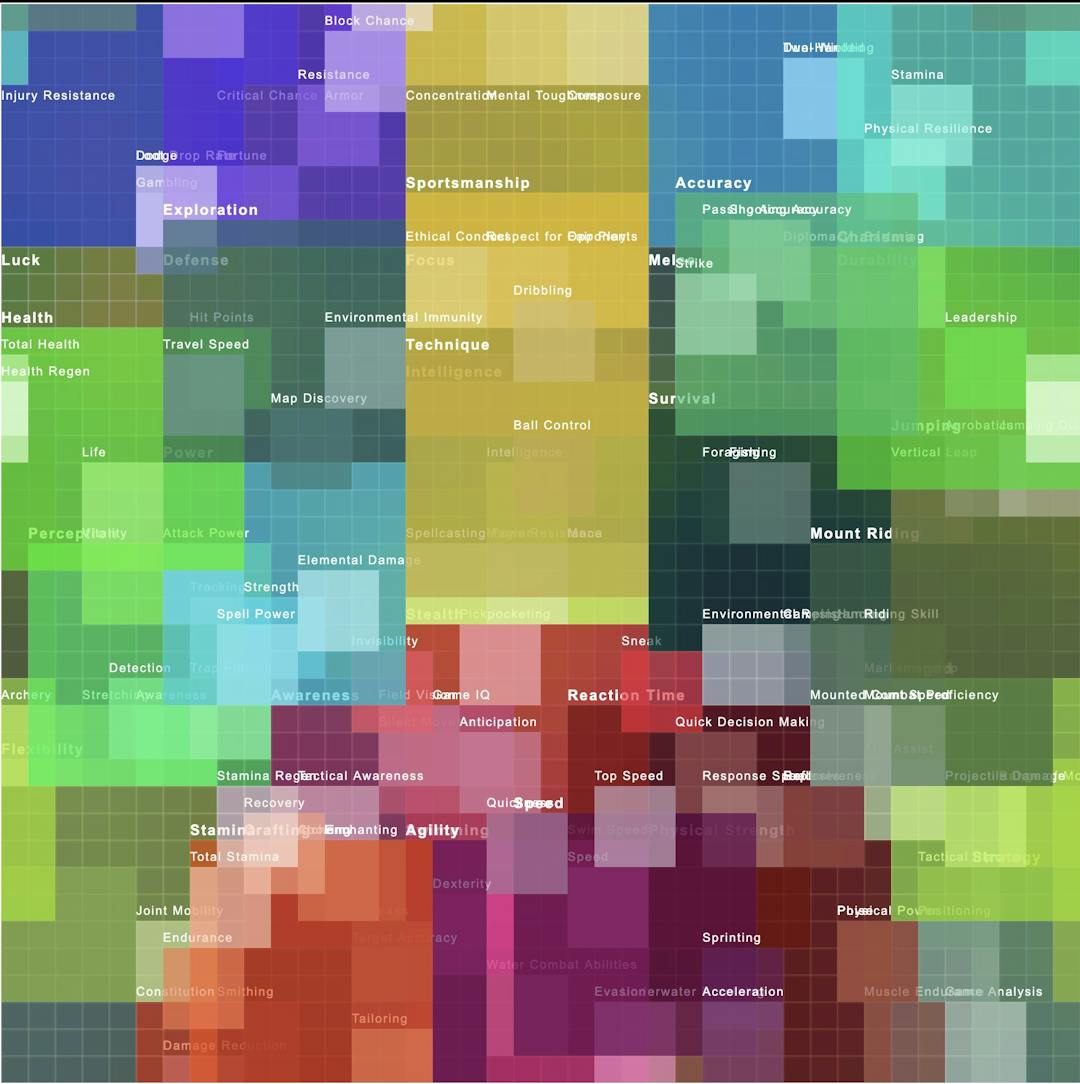
How to read the mapping data
How to read the data.
The data available to download is a JSON file containing an array of attributes. Each attribute has the following properties: ID, Name, Color, Size, X and Y.
The size represents the height and width of the mapped attribute, with the X and Y representing the grid cell from which the center of the attribute is located.
The size represents the height and width of the mapped attribute, with the X and Y representing the grid cell from which the center of the attribute is located.
[{
  "id": 100,
  "name": "Health",
  "color": "#30f000",
  "size": 9,
  "x": 7,
  "y": 7
}]
The grid is 40 x 40 with the top left corner being 1, 1 and the bottom right corner being 40, 40.
Where an attribute is mapped to a grid cell near the edge of the grid, the attribute will wrap around to the opposite side of the grid.
Where an attribute is mapped to a grid cell near the edge of the grid, the attribute will wrap around to the opposite side of the grid.
Mapping Stats
0
Wallets
Mapped in the Community Genome Mapping Experience
0
%
Of Owners
Mapped in the Community Genome Mapping Experience
0
Genesis Brains
Held by the wallets that took part
0
%
Of Brains
Held by the wallets that took part
More Stats
0
.
0
Average Brains
Held by each wallet that took part
0
Most Brains
Held by a single wallet that took part
0
Health
Most Mapped Attribute
0
Mounted Combat Proficiency
Least Mapped Attribute
Downloads
We have a number of downloads available for you to explore the data yourself.
All Raw Data
Download the raw data from the mapping event in JSON format.
Max Value Based Data
Download processed data that maps attributes based on the cell with most mapped overlaps.
Density Based Data
Download processed data that maps attributes based on the attribute area that is most densely mapped.
Download Density Data
Build Your Own Map
We have a tool that can help you build your own map of required attributes based on either the max value or density based data. You can then download that data in JSON format.
Create Max Value Based Map
Create & download processed data that maps attributes based on the cell with most mapped overlaps.
Create Density Based Map
Create & download processed data that maps attributes based on the attribute area that is most densely mapped.
Create & Download Your Density Map